Within the C-FARMs project, TERRASYSTEM, with the support of FederlegnoArredo, Confagricoltura and Università degli Studi della Tuscia di Viterbo, has coordinated the development of the C-FARMs Carbon Farming Simulator, a prototype of a geo-spatial information system that allows users to simulate scenarios on the potential for carbon sequestration and/or reduction of CO2 emissions, associated with the adoption of carbon farming practices. The application enables analyses at both farm and regional level, based on the use of preset algorithms defined in Actions A2, A3 and A4 of the project. Furthermore, through a WebGIS interface, the data and maps defined and/or produced in action A4 “Creation of the High-resolution geographical information system for the reference region (GIS-FARMs)” were published.
Specifically, the C-FARMs project has generated new and reliable levels of information on the initial SOC (Soil Organic Carbon) level of agricultural soils and the associated carbon sequestration potential by providing two different simulation algorithms:
– the ‘IPCC method’ is based on the IPCC guidelines (IPCC, 2006) to assess the change in soil organic carbon (SOC) stock as a function of changes in agricultural practices (simulated by the user) and environmental constants. Simulations with the ‘IPCC’ method are possible over the entire agricultural area of Lombardy;
– the ‘C-FARMs method’ (Università degli Studi della Tuscia, 2022) enhances instead the spatial integration of existing geodatabases (FAO GSOC map, Climatic stratification of the Environment of Europe, Land use and soil use map of the Lombardy Region): it is based on the association of the statistically evaluated SOC content and SOC sequestration potential to homogeneous areas derived from the stratification of climate, soil type and land use layers, and on a set of scenarios of carbon farming practices. Simulations with the ‘C-FARMs method’ are possible on a part of the regional agricultural area (approx. 54%).
The user interface of the demonstrator, which will soon be available on the project website, is divided into three main sections, briefly described here.
WebGIS section
The WebGIS makes it possible to consult and navigate the maps produced within the A4 C-FARMs action, as a spatial database of input data for the simulation algorithms. The cornerstone of the processing flow is the use of “strata”, homogeneous classes by environmental climate/soil texture/soil use, as the basic unit to which information on soil organic carbon and change scenarios can be referred.
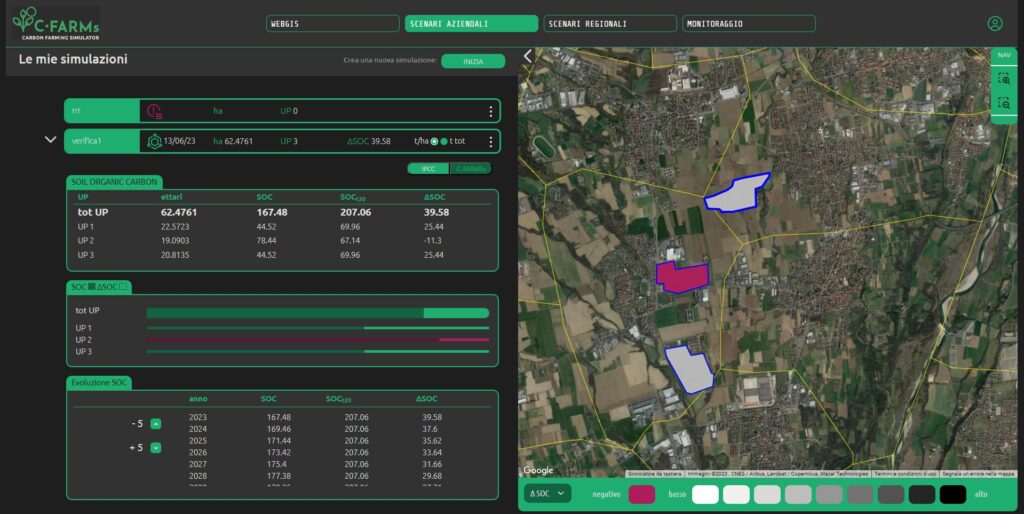
Farm Scenarios section
Farmers can upload their own map of agricultural plots and assess their current carbon stock and its potential change related to the adoption of carbon farming practices. The interactive map supports the drawing of plots and displays the results as a thematic map.
Regional Scenarios section
Public authorities, decision-makers and researchers in this section can carry out simulations in which, knowing the area statistics of regional crop types, and making assumptions about the conversion of some of them to a ‘carbon farming’ type of management, they obtain estimates of aggregated SOC stock change values over large territorial/administrative areas (a province or groups of provinces). This tool can be a valuable support to agricultural and environmental management policies.